The Roadmap
The answer is coming in 2015 when a new “Roadmap to Net Zero Construction and Deep Energy Retrofits by 2030” is completed. The Roadmap will describe tangible policy options and market mechanisms for governments, non-profits and businesses to facilitate energy efficiency in buildings.
The Roadmap is being developed by the Pacific Northwest Economic Region (PNWER), a non-profit organization created in 1991 by 10 northwest jurisdictions in Canada and the United States. PNWER includes legislators (MLAs, Cabinet Ministers, Senators and Representatives), private sector leaders (including utilities) and government officials. While PNWER is a State/Provincial/Territorial level organization, their work frequently involves local governments.
There are five key reasons this Roadmap is needed, namely:
- Increases in electricity rates, with proportionate options to reduce consumption
- Need for leadership to address persistent market barriers to energy efficiency
- Significant opportunities to improve energy efficiency at the time of planning and construction of new buildings and renewal of existing buildings
- Opportunities to create jobs – thousands in BC; and tens of thousands in PNWER
- The global imperative to reduce greenhouse gas emissions and need for regional action
I will focus on the first two points in this month’s blog post, describing the problem, and then illustrating some examples of what local, state and provincial governments are already doing to address the problem. If you are a legislator or government official, this will give you some ideas for policy solutions. If you are anyone else in the building industry, you will learn more about leadership opportunities to be ahead of government policy.
Reason 1: Electricity Rate Increases
Electricity prices increased by 9% in British Columbia in 2014 and will increase a further 6% on April 1, 2015; to invest in system upgrades that are critical to our power system reliability. By comparison, the Consumer Price Index (normal inflation) increased by 1.1% in BC in one year, up to October 2014. The recent electricity rate increase exceeded inflation by a factor of 7.
Many will suggest that electricity rates are so low that even a sizable rate increase will have minimal impact. However, electricity bills are likely the single largest increase in the cost of building management. RDH’s research among 92 high-rise, and 111 low-rise multi-unit residential buildings, found that about 18% of the total costs was a result of energy costs (including electricity and natural gas), the third highest cost after maintenance and repairs (32%) and administration, insurance and management (22%). RDH’s Maintenance and Planning webpage provides further background on maintenance and planning of buildings.
Fortunately, there are opportunities to maintain or reduce energy bills despite rate increases (reason #3). In the next blog post I will provide more details on a condominium retrofit project in the west side of Vancouver that achieved a 46% reduction in suite electricity consumption through a building enclosure renewal. I will also write about analysis to achieve deep energy reductions in heritage designated buildings based on a study of three buildings (office, rental housing, condo) in downtown Victoria.
Natural gas rates are low and stable – however, many jurisdictions have, or will be assigning a market price for carbon emissions that provides an incentive to invest in energy efficiency improvements. In the case of British Columbia, the $30/tonne carbon tax is currently equal to 19% of the FortisBC business (rate 2) natural gas price.
Reason 2: Market Barriers Requiring Leadership
Many home owners and building tenants are “captive” to their energy bills due to persistent market barriers. I will illustrate this for two sectors – condominium housing and rental offices.
A key barrier for condos is that individual owners pay their suite electricity bills, while the strata corporation controls the investment decisions that affect the heat loss from the building enclosure, and hence the load for in-suite space heating. This leads to investment decisions that may not optimize energy efficiency for the whole building, but rather only for the common area spaces.
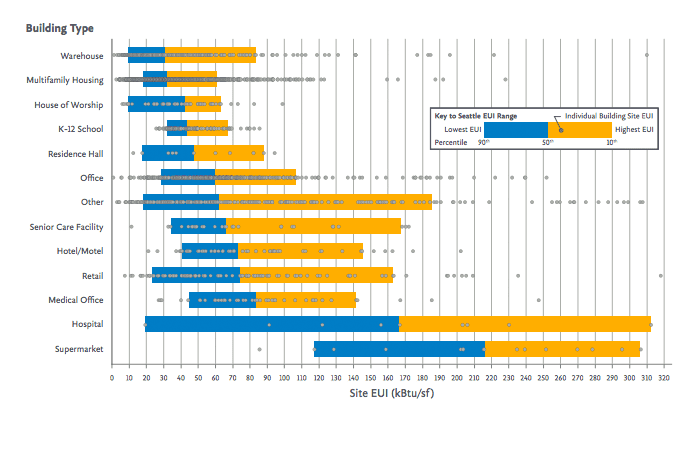
Local governments can help address this barrier by increasing awareness of whole-building energy consumption through building energy benchmarking policies, such as initiatives in Vancouver and Seattle. Some local governments and industry associations publish non-confidential metrics on the average energy use intensity of buildings; allowing individual building owners and managers to compare their buildings’ use against the “benchmark”. The two charts below illustrate the metrics for nearly 3,000 buildings with a floor area over 20,000 ft2 in Seattle and 400 BOMA BESt Level 2,3,4 certified buildings across Canada.

Another barrier that prevents action by motivated stratas is the lack of practical access to whole-building energy consumption data, necessary to complete energy efficiency studies. Due to data privacy policies, building managers are required to obtain authorization from every meter owner to access the data from utilities. In most situations that is not practical.
The State of Washington solved this problem with the 2009 Senate Bill 5854 that allowed building operators to sign off on behalf of owners and utilities to load the energy data into ENERGY STAR® Portfolio Manager. You can click on the links to see Puget Sound Energy, Seattle City Light and AVISTA’s benchmarking data webpages.
For office buildings, the issue is that their rent is based on location, class of property and market conditions; while energy bills are often distributed through the “triple net lease”. The “split incentive barrier” is that the landlord would be responsible for investing in comprehensive energy upgrades necessary to lower energy bills, whereas the tenants benefit through lower bills; but the lease rates are not yet differentiated for energy consumption.
A solution is a “green lease” or “energy aligned clause” within standard lease language; an initiative championed by the City of New York. This is ideally suited for leadership by public sector organizations and local governments that lease buildings.
Case Study – Vancouver’s Energy Retrofit Strategy for Existing Buildings
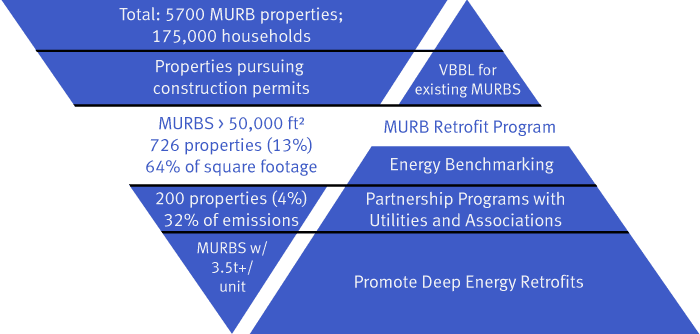
Vancouver recently completed an “Energy Retrofit Strategy for Existing Buildings” that applies a targeted approach to promoting retrofits, illustrated in the double triangle diagram below for multi-unit residential buildings (MURBs), and prepared by RDH for the City under a consulting contract.
Starting with the left triangle, there are approximately 5,700 properties in Vancouver with 175,000 homes. The Vancouver Building Bylaw (VBBL) is expected to apply to those properties with new energy efficiency provisions that take effect on January 1, 2015. The City has launched an energy benchmarking program that will focus on the largest buildings, over 50,000 ft2 of floor space; representing 64% of the floor area with only 13% of the properties. This will allow the property managers to identify the most appropriate large buildings for energy audits (200 buildings account for 32% of emissions) and deep energy retrofits (for buildings with emissions greater than 3.5 tonnes/year/residential unit).
The triangle on the right represents the emission reductions per building as a result of various policy approaches. This becomes an optimization exercise of identifying and facilitating energy retrofits of those buildings with the largest and most cost-effective potential.
Next Blog Post
In my next blog post (January 2015) I will provide more details on the PNWER Roadmap initiative and how local governments and building owners and manager associations can get involved. I will provide case studies to support “Reason #3” for the Roadmap – the opportunities to incorporate energy efficiency at the time of building repair and renewal. You can also see my October 2012 APEGBC Innovation Journal article on this topic.
About this Blog
My postings on RDH Building Engineering’s “the Wall” blog will be disseminated through the BC Climate Action Toolkit LinkedIn Group, providing climate protection tools for local government staff, senior management and elected officials; and through the Building Owners and Managers Association (BOMA) of BC energy newsletter.