This Toronto Metropolitan University (TMU) x RDH study and resulting database—funded by The Atmospheric Fund (TAF)— inform design decisions at the earliest stages (before details are established) with critical consideration of embodied carbon.
Readily available comparative data from studies on assemblies such as this opens up the opportunity to reconsider how materiality can significantly reduce embodied carbon emissions in buildings.
Background
The AEC industry is at an inflection point. A significant portion of a building’s embodied carbon emissions occurs before and during its construction, while the operational emissions from a building’s energy use are drawn out throughout the building’s lifespan. Because embodied carbon emissions happen up front, this means that reducing embodied carbon is even more crucial to achieving near-term emissions reduction goals.
Our collective effort to bring this information to the fore serves designers and manufacturers as they make considered and thoughtful decisions on their building enclosure systems.
TMU x RDH also sees this comparative data as a resource for policymakers to right-size mandates, alternatives, and incentives.
Embodied carbon emissions refer to the amount of GHG emissions associated with upstream stages of a product’s life, i.e., raw material extraction, processing, transportation, and manufacturing. These emissions are not well understood yet contribute significantly to the total carbon emissions produced over a building’s lifespan.
The Study and Outcome
Embodied carbon metrics for twenty-six (26) enclosure systems commonly used in the Greater Toronto and Hamilton Area (GHTA) were analysed using a standardized life cycle assessment methodology for calculating CO2 equivalent embodied emissions.
The results break down emissions by material layer, showing which components have the most negative impact (and where opportunities to reconsider material choice are available).
This comparative data can be used to inform decisions during concept design, before project specifications and detailed drawings are developed and priced, enabling project and team efficiency, productivity, and streamlining.
For more detailed information about this initiative, download our Guidance Document.
Summary of Wall, Roof, and Floor Assemblies
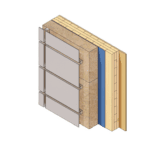
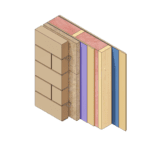
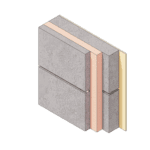
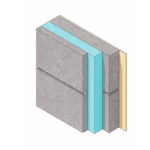
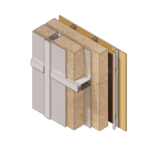
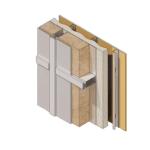
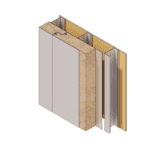
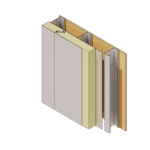
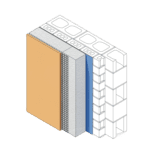
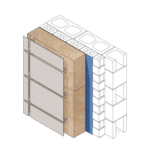
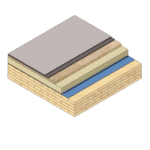
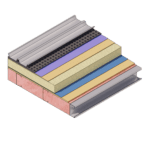
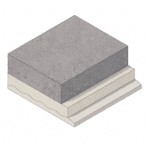
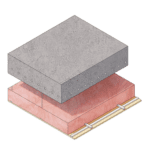
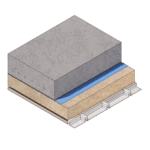
Wall Assemblies
This portion of the study compares the environmental performance of seventeen (17) wall assembly options using a series of whole-building life cycle assessments (LCAs) to understand the embodied carbon impact of each of the different wall systems.
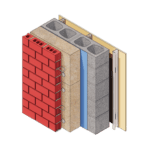
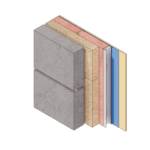
W01: EXTERIOR INSULATED CMU WITH BRICK VENEER
| R-Value | Rsi 4.6 m² K/W R 26 ft²·°F·h/BTU |
| Embodied Carbon per m² Enclosure (A1-A3) | 136.3 KgCO₂/m² |
| Biogenic Carbon per m² of Enclosure | 0 KgCO₂/m² |
 W02: SPLIT INSULATED STEEL FRAME WITH LIGHTWEIGHT CLADDING
| R-Value | Rsi 4.4 m² K/W R 25.2 ft²·°F·h/BTU |
| Embodied carbon per m² enclosure (A1-A3) | 110.3 KgCO₂/m² |
| Biogenic carbon per m² of enclosure | -0.4 KgCO₂/m² |
 W03: SPLIT INSULATED STEEL FRAME WITH EIFS (EPS)
| R-Value | Rsi 4.51 m² K/W R 25.6 ft²·°F·h/BTU |
| Embodied carbon per m² enclosure (A1-A3) | 50.12 KgCO₂/m² |
| Biogenic carbon per m² of enclosure | 0 KgCO₂/m² |
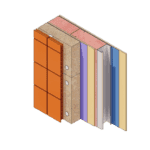
 W04: EXTERIOR INSULATED CLT WALL PANEL WITH ALUMINUM CLADDING
| R-Value | Rsi 4.4 m² K/W R 24.9 ft2·°F·h/BTU |
| Embodied carbon per m² enclosure (A1-A3) | 56.43 KgCO₂/m² |
| Biogenic carbon per m² of enclosure | -80.3 KgCO₂/m² |
 W05: SPLIT INSULATED WOOD FRAME WITH MINERAL WOOL AND STONE VENEER CLADDING
| R-Value | Rsi 4.26 m² K/W R 24.2 ft2·°F·h/BTU |
| Embodied carbon per m² enclosure (A1-A3) | 60.42 KgCO₂/m² |
| Biogenic carbon per m² of enclosure | -25.8 KgCO₂/m² |
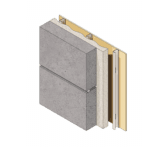
 W06: DOUBLE WHYTHE INSULATED PRECAST WITH KOOLTHERM
| R-Value | Rsi 4.4 m² K/W R 25 ft2·°F·h/BTU |
| Embodied carbon per m² enclosure (A1-A3) | 166.16 KgCO₂/m² |
| Biogenic carbon per m² of enclosure | 0 KgCO₂/m² |
 W07: DOUBLE WHYTHE INSULATED PRECAST WITH XPS INSULATION
| R-Value | Rsi 4.5 m² K/W R 25.4 ft2·°F·h/BTU |
| Embodied carbon per m² enclosure (A1-A3) | 209.30 KgCO₂/m² |
| Biogenic carbon per m² of enclosure | 0 KgCO₂/m² |
 W08: SPANDREL PANEL WITH 3″ MINERAL WOOL BACKPAN, INTERIOR INSULATED WITH MINERAL WOOL
| R-Value | Rsi 4.7 m² K/W R 26.7 ft2·°F·h/BTU |
| Embodied carbon per m² enclosure (A1-A3) | 94.82 KgCO₂/m² |
| Biogenic carbon per m² of enclosure | 0 KgCO₂/m² |
 W09: SPANDREL PANEL WITH 3″ MINERAL WOOL BACKPAN, INTERIOR INSULATED WITH SPRAY FOAM
| R-Value | Rsi 4.3 m² K/W R 24.4 ft2·°F·h/BTU |
| Embodied carbon per m² enclosure (A1-A3) | 74.48 KgCO₂/m² |
| Biogenic carbon per m² of enclosure | 0 KgCO₂/m² |
 W10: INSULATED METAL PANEL WITH MINERAL WOOL INSULATION
| R-Value | Rsi 4.4 m² K/W R 24.9 ft2·°F·h/BTU |
| Embodied carbon per m² enclosure (A1-A3) | 94.49 KgCO₂/m² |
| Biogenic carbon per m² of enclosure | 0 KgCO₂/m² |
 W11: INSULATED METAL PANEL WITH POLYISOCYANURATE INSULATION
| R-Value | Rsi 5.2 m² K/W R 29.7 ft2·°F·h/BTU |
| Embodied carbon per m² enclosure (A1-A3) | 105.2 KgCO₂/m² |
| Biogenic carbon per m² of enclosure | 0 KgCO₂/m² |
 W12: ARCHITECTURAL PRECAST WITH MINERAL WOOL INTERIOR INSULATION
| R-Value | Rsi 4.2 m² K/W R 24.1 ft2·°F·h/BTU |
| Embodied carbon per m² enclosure (A1-A3) | 135.8 KgCO₂/m² |
| Biogenic carbon per m² of enclosure | 0 KgCO₂/m² |
 W13: ARCHITECTURAL PRECAST WITH SPRAY FOAM INTERIOR INSULATION
| R-Value | Rsi 4.7 m² K/W R 26.6 ft2·°F·h/BTU |
| Embodied carbon per m² enclosure (A1-A3) | 114.3 KgCO₂/m² |
| Biogenic carbon per m² of enclosure | 0 KgCO₂/m² |
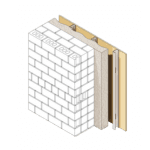
 W14: EXISTING MASONRY WITH INTERIOR MINERAL WOOL INSULATION
| R-Value | Rsi 4.2 m² K/W R 24.0 ft2·°F·h/BTU |
| Embodied carbon per m² enclosure (A1-A3) | 33.7 KgCO₂/m² |
| Biogenic carbon per m² of enclosure | 0 KgCO₂/m² |
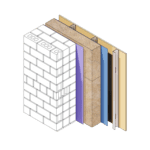
 W15: EXISTING MASONRY WITH INTERIOR SPRAY FOAM INSULATION
| R-Value | Rsi 4.7 m² K/W R 26.8 ft2·°F·h/BTU |
| Embodied carbon per m² enclosure (A1-A3) | 9.8 KgCO₂/m² |
| Biogenic carbon per m² of enclosure | 0 KgCO₂/m² |
 W16: EXISTING MASONRY WITH EXTERIOR EIFS OVERCLADDING
| R-Value | Rsi 4.4 m² K/W R 24.8 ft2·°F·h/BTU |
| Embodied carbon per m² enclosure (A1-A3) | 22.9 KgCO₂/m² |
| Biogenic carbon per m² of enclosure | 0 KgCO₂/m² |
W17: EXISTING MASONRY WITH EXTERIOR ALUMINUM PANEL OVERCLADDING
| R-Value | Rsi 4.4 m² K/W R 24.8 ft2·°F·h/BTU |
| Embodied carbon per m² enclosure (A1-A3) | 52.5 KgCO₂/m² |
| Biogenic carbon per m² of enclosure | 0 KgCO₂/m² |
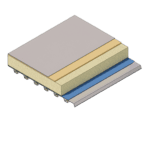
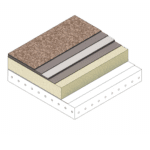
Roof Assemblies
These five (5) roofing assembly comparisons help us better understand the interplay of fundamental requirements like heat, air, vapor, and water control along with growing considerations for embodied carbon, resilience to wildfires and water, and materiality.
R01: CONVENTIONAL ROOF WITH POLYISO ON METAL DECK
| R-Value | Rsi 5.2 m² K/W R 29.6 ft2·°F·h/BTU |
| Embodied carbon per m² enclosure (A1-A3) | 46.3 KgCO₂/m² |
| Biogenic carbon per m² of enclosure | 0 KgCO₂/m² |
R02: PROTECTED MEMBRANE ROOF WITH XPS ON CONCRETE DECK
| R-Value | Rsi 5.6 m2 K/W R 31.7 ft2·°F·h/BTU |
| Embodied carbon per m² enclosure (A1-A3) | 148.4 KgCO₂/m² |
| Biogenic carbon per m² of enclosure | 0 KgCO₂/m² |
R03: CONVENTIONAL MODIFIED BITUMEN ROOF WITH HYBRID INSULATION ON CLT DECK
| R-Value | Rsi 4.4 m² K/W R 24.8 ft2·°F·h/BTU |
| Embodied carbon per m² enclosure (A1-A3) | 48.1 KgCO₂/m² |
| Biogenic carbon per m² of enclosure | 1269.96 KgCO₂/m² |
R04: EXISTING BUR ROOF REPLACEMENT OVER POLYISOCYANURATE INSULATION
| R-Value | Rsi 5.5 m² K/W R 31.2 ft2·°F·h/BTU |
| Embodied carbon per m² enclosure (A1-A3) | 52.31 KgCO₂/m² |
| Biogenic carbon per m² of enclosure | 0 KgCO₂/m² |
R05: SLOPED METAL ROOF ASSEMBLY
| R-Value | Rsi 5.5 m² K/W R 31.4 ft2·°F·h/BTU |
| Embodied carbon per m² enclosure (A1-A3) | 120.8 KgCO₂/m² |
| Biogenic carbon per m² of enclosure | 0 KgCO₂/m² |
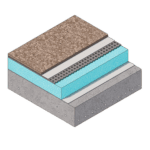
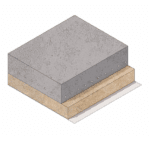
Floor Assemblies
The final aspect of our enclosure study is focused on flooring options. We selected and analysed four (4) common options.
F01: PARKING GARAGE CONCRETE CEILING WITH VINYL-FACED MINERAL WOOL
| R-Value | Rsi 4.6 m2 K/W R 26 ft2·°F·h/BTU |
| Embodied carbon per m² enclosure (A1-A3) | 168.4 KgCO₂/m² |
| Biogenic carbon per m² of enclosure | 0 KgCO₂/m² |
F02: PARKING GARAGE CONCRETE CEILING WITH FIRE RESISTANT SPRAY INSULATION
| R-Value | Rsi 4.5 m² K/W R 25.7 ft2·°F·h/BTU |
| Embodied carbon per m² enclosure (A1-A3) | 148.4 KgCO₂/m² |
| Biogenic carbon per m² of enclosure | 0 KgCO₂/m² |
F03: PARKING GARAGE INSULATED DROPPED CEILING (HEATED PLENUM)
| R-Value | Rsi 4.6 m² K/W R 26.1 ft²·°F·h/BTU |
| Embodied carbon per m² enclosure (A1-A3) | 149.8 KgCO₂/m² |
| Biogenic carbon per m² of enclosure | 0 KgCO₂/m² |
F04: INSULATED SOFFIT WITH MINERAL WOOL
| R-Value | Rsi 3.7 m² K/W R 21.1 ft2·°F·h/BTU |
| Embodied carbon per m² enclosure (A1-A3) | 138.2 KgCO₂/m² |
| Biogenic carbon per m² of enclosure | 0 KgCO₂/m² |
Future Partnerships and Continued Work
The push to reduce the overall embodied carbon emissions of our buildings through careful selection of materials specified in the design and used for construction is inhibited by a lack of data. Opaqueness and inaccessibility make it difficult to evaluate the carbon impacts of products used in the building process and make low-carbon choices in building materials. We see partnerships, like what we have with TMU and TAF, as critical to addressing these global challenges.
RDH’s mission is to Make Buildings Better, and as such, we are always in search of like-minded institutions, researchers, practitioners, organizations, and investors that can help us build upon this body of knowledge for the sake of this generation and the next.
RDH Building Science Leadership


Led by Senior Building Science Consultant, Kelsey Saunders, and Passive House Project Manager, Rehanna Devraj-Kizuk, this study will go on to help building owners, architects, and others optimize material selection to reduce embodied carbon in commercial and industrial buildings and mitigate climate change.