Energy-efficient design in new and existing buildings is helping North Americans reduce the carbon footprint of our communities and cut energy bills. A key element in achieving energy efficiency is to measure and verify energy savings and emissions reductions, ensuring that high-performance buildings continue to perform: enter RDH.
In 2013 RDH was retained by an electrical utility to undertake a two-part study focused on the measurement and verification of energy savings in a sample of residential, community, commercial and mixed-use buildings, all of which were designed as high-performance developments and constructed within the last ten years.
Based on key findings and lessons learned from our work, this four-part blog series explores the topic of high-performance buildings, how we measure their energy efficiency, and how we can ensure buildings achieve their performance goals during operations.
In Part 1, we explored the measured performance of a handful of recent high performance buildings. In Part 2, we dig deeper into how performance can vary from the intended design or energy model. And Parts 3, and 4 will discuss how building designers, owners, and managers can ensure their buildings perform at their best.
In Part 1 of this blog series, Show Me the Numbers: Measured Energy Consumption of High-Performance Buildings, we discussed energy modelling and the importance of verifying energy consumption once a building is completed and in use. Comparing modelled and measured EUIs, and using benchmarking to compare a building to its peers, allows us to assess a building’s actual energy performance. While this is extremely important in the construction of high performance buildings, energy models are often meant to predict energy savings, rather than consumption and actual utility costs.
How do we measure and verify energy savings in new buildings?
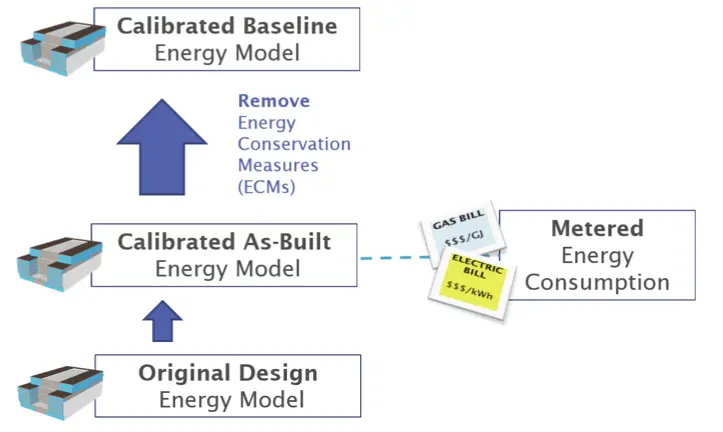
Since we don’t have historical energy consumption to compare to for savings, we use energy modelling to help compare the building’s actual performance to a theoretical baseline without any ECMs. We start by calibrating an energy model to the actual building consumption, typically metered by the utilities. This requires at least one year of “normal operations”—what we’d call a calibrated, as-built energy model. Once we have a model that represents how the building actually uses energy, we then remove the ECMs to generate a calibrated baseline model, which shows us what the consumption would have been if the ECMs had not been included. By comparing the two we find the “verified” savings.
The process of calibrating an energy model to metered data has to be done carefully. As with most models, it’s always possible to force simulation results to align with a data set, although the approach might not be meaningful. What’s important, though, is doing it in a way that reflects what’s actually happening at the building. We’ll typically group inputs into two categories: things we know, and things we don’t know. Among the variables that we don’t know, we’ll estimate a range of plausible values. We then calibrate the model by turning the dials within a reasonable range until the results begin to align. Some insight can be gained from monthly data by observing seasonal trends and variations; with a little practice a modeller can recognize patters in the modelled-versus-metered results to identify possible sources of discrepancies.
As the International Performance Measurement and Verification Protocol (IPMVP) puts it, calibrated modelling “requires considerable skill.” This is critically important to ensure the study provides useful information as well as an understanding of the limitations, and where more detailed information is needed. ASHRAE Guideline 14 gives direction on reasonable margins for error for calibrating a model to metered data.
Calibration can be further informed by monitored or sub-metered information, including information contained within a building’s controls system. Hourly consumption from a controls system or from smart meters can also be useful to compare to hourly simulation results for shorter periods, like a single day.
Another important aspect in calibrating these models is to consider the weather that the building experienced over the verification period. In this study we calibrated the as-built energy model using weather data from an Actual Meteorological Year (AMY) file—the same year in which the energy use was measured. Once calibrated, the model is run using data from a Typical Meteorological Year (TMY). This is done so that energy savings can be stated for an average or typical weather year. This provides a more accurate picture of average savings, which will fluctuate from year to year due to changes in weather.
This measurement and verification (M&V) process was used consistently throughout phase 2 of the RDH study, assessing the energy savings of 9 projects. For more information about M&V processes, visit the International Performance Measurement and Verification Protocol (IPMVP) library.
Comparing Savings
In our study, we compared predicted versus verified savings for several projects. The graph below shows this comparison for the office and residential projects that we looked at. All but one of these projects saw higher than predicted savings using the calibrated modelling approach. Including ECMs in these projects clearly has a positive impact in reducing their energy footprint.
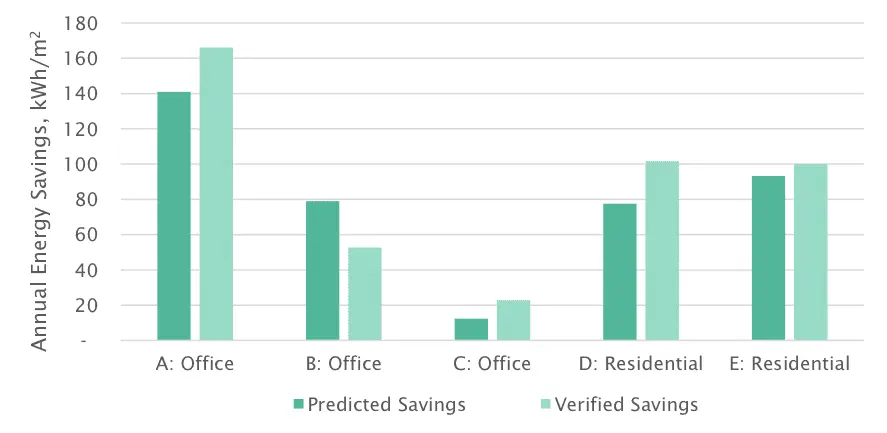
In our last post we showed that the handful of “high performance buildings” had higher Energy Use Intensities (EUIs) than their original models, and were intended for comparison rather than predicting consumption. Here, our comparison of savings shows that incorporating ECMs into these buildings did realize significant energy savings.
Although the savings compared favourably, how the savings were achieved worked out quite differently in the calibrated and verified models compared to the initial simulations.
In the next instalment of this 4-part blog series, we’ll delve further into details of how the energy savings observed were different from what was predicted or planned for in the design, and begin to tackle the question of how building designers, owners, and managers can ensure their buildings perform at their best.